Let's
not go shopping!
And now, for something completely different: the wealth gap.
 He steals from the poor...and gives to the rich...Stupid bitch!...
*****
And now:
Progressive Gold reminds me of a post I'd been wanting to make, with
this Scotsman article:
TWO per cent of adults on the planet command more than half of the world's wealth, while the bottom 50 per cent possesses just 1 per cent, according to comprehensive new research.
While income is distributed unequally across the globe, the geographical spread of wealth - which includes property and financial assets - is even more skewed, the study by the World Institute for Development Economics Research of the UN University showed.
"Wealth is heavily concentrated in North America, Europe and high-income Asia- Pacific countries. People in these countries collectively hold almost 90 per cent of total world wealth," the survey said.
The Helsinki-based institute said this was the first global research on the topic, for which there are only limited data. The study is based on figures from 2000. According to the report "the same degree of inequality would be obtained if one person in a group of ten takes 99 per cent of the pie and the other nine share the remaining 1 per cent.
...The two most asset-rich countries are Japan and the United States. In the US, average wealth amounted to £72,800 per person in the year 2000, and £91,500 in Japan.
In India, the figure was just £560 and in Indonesia, per capita wealth was £710.
Even among high-income nations, the amounts vary, from £18,700 per person for New Zealand and £35,390 for Denmark to £64,200 for Britain.
Although North America has only 6 per cent of the world's adult population, it accounts for 34 per cent of household wealth."If you're reading this and saying, well, shit, I live in North America/Britain/wherever and i don't -feel- rich, you might be right:
Still, many in the wealthy West are house-poor, with assets well below this number due to mortgages and other debt.
"Many people in high-income countries have negative net worth and - somewhat paradoxically - are among the poorest people in the world in terms of household wealth," the report said.*****
So, this probably isn't news, right? I mean, we've all heard of the "First World, "Third World," right?
What about the news that this trend has actually been getting worse, not better, over the last few decades?
And that it's not just about one country's wealth versus another's; it's about a HUGE amount of wealth becoming increasingly concentrated in a very few individuals' hands?
From the
Global Policy Forum:
Let us take some accepted, indeed indisputable, facts. One, the combined wealth of the world’s three richest people is greater than the total gross domestic product of the 48 poorest countries. I'm going to just pause and let that one sink in before going on. I don't know about y'all, numbers and statistics and so forth tend to make me glaze over; but this one, well,
Let us take some accepted, indeed indisputable, facts. One, the combined wealth of the world’s three richest people is greater than the total gross domestic product of the 48 poorest countries. Okay? Okay. Moving on:
Two, in 1960, the average income of the richest 20 per cent of the world’s population was 30 times higher than that of the poorest 20 per cent. By 1995, this had become 82 times greater (United Nations Development Programme Report 1998). Three, in 1970, the gap between the per capita GDP of the richest country, the United States of America ($5070) and of the poorest, Bangladesh ($57) was 88:1. In 2000, the gap between the richest, Luxembourg ($45,917) and the poorest, Guinea Bissau ($161) was 267:1.That article goes on to lay out the most common responses to these figures, by what they term "neoliberals," i.e. defenders of the current economic model: "growth," "free trade," "globalization," deregulation, that sort of thing, one presumes. Apaprently they boil down to, "well, you have to break eggs to make an omelette" and "lies, damned lies and statistics." (My own somewhat flip reading: read
the article for their own words and citations).
*****
But so okay; maybe at this point you're thinking, well, the entire world, that's a bit abstract; global village, schmobal village, I live -here.-
Well, let's assume for now "here" is the U.S., as it is for me and it is for a goodly chunk of y'all reading me here, based on my stats (more numbers!), if obviously not all of y'all.
So, here we go.
From
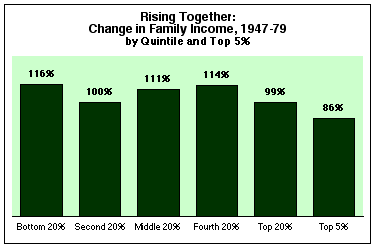
United for a Fair Economy: this is a chart roughly breaking down the rise of income for Americans, divided by relative wealth into five chunks, (with an extra category for the top 5%; you'll see why in a minute) from bottom to top, during the "boom years," the "wonder years," 1947-1979.

As you can see, here in fact, at least within the bounds of this country, it probably is as fair as it ever is to have said that the "rising tide lifted all boats." In fact, the relative income of the bottom 20% rises by more than does the top 20%. (by 116% and 99%, respectively). And within that top 20% sector, the wealthiest 5% income rises by--percentage-wise, you understand, they're still the "wealthiest 5%"--even less, but still a healthy 86% increase, overall. Okay.
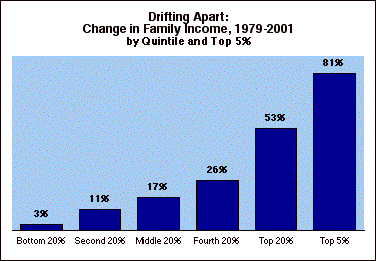
Now, this is the chart they have for 1979-2001: (yes, this is including the golden Clinton years, it would seem):

So, bottom quintile (that's a great word, isn't it? "quintile") income rose in those 22 years by...3%.
Wealthiest 20% of the U.S. pop's income rose by...53%.
And the richest 5% of the population's income increased by...81%.
Oh, apparently this is
before taxes.
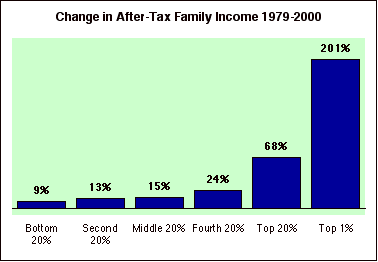
After taxes, it breaks down like this:

So, relatively speaking, the bottom 20% does a little better than before: 9%. On the other hand, the top 20% makes out at a 68% increase, over the years.
And the very richest 1% sees an increase of income of
201%, from 1979-2001.
Now, "income," (what you earn) as we know, is not synonymous with "wealth" (what you have).
Here's the chart for how
that breaks down as of 2001, mkay:

Yes, you're reading that right, assuming I am and you're reading it as I'm reading it: the wealthiest
1% of the U.S. population--so, what, about 3 million people or so?--between them, own just about exactly one third of ALL the "wealth" in the country, as estimated by and how whoever estimates such things (approximately $43 trillion dollars).
And, while this particular chart doesn't say so, I am willing to bet--and will back this up, later, if i find the stats--that of that 1%, a much much small percentage owns a relative even huger chunk of
that. Without the actual figures, I won't swear that the wealthiest .1 or .01% of the population own more than even the rest of that top 1% put together, but it wouldn't surprise me either.
also remembering, again:
Let us take some accepted, indeed indisputable, facts. One, the combined wealth of the world’s three richest people is greater than the total gross domestic product of the 48 poorest countries. So. Of the remaining 2/3 of the wealth--money, "goods," property, stock, what have you--of the U.S., according to the above chart, HALF the country--the poorer half, natch--has to divide a mere
2.8% between them. So that's, what, 150 million people, give or take? and 3% of 43 trillion bucks...christ, I don't know. All I do know is: it's a lot a LOT less than what the richest 3 million or so own all by theyselves.
(of course, that is slightly better, percentage-wise, than the stats for the ENTIRE WORLD, as we've seen; in which half the world (i.e., what, 3-4 billion people?) share between them
1% of all the wealth in the world.
And then, the so-called middle class--the next 40%, so, you know, of the people who aren't in the bottom half, all but the top richest 10% of the population--they get a bit more than a quarter more, of the wealth, between them.
The remaining chunk is divvied up between what i guess would now be the, well, I don't know how you'd "class" people according to this chart; my guess is that a lot of 'em, this top-10-except-for-the-very-richest-1% of the population, still think of themselves of middle class--as do a lot of people in that lower 50%, because everyone in the U.S. is middle class, you know? There is no such thing as "class"--
--anyway, that lot, the wealthiest-except-for-the-very-tiptop, shares somewhat more than another third of the country's entire wealth between them. Surprise surprise, the richer half of -that- strata has more than twice as much as the rest of 'em.
(Speaking of pre-1980's; anyone else remember this bit from
Sesame Street? "Let's share a banana, Ernie; I'll have the banana, and you get the peel!" perhaps i misremember; i was but a babe. anyway
Bert is Evil, as everyone knows).
*****
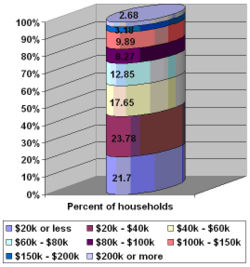
Okay, so, but what does that mean in terms of actual dollars, currently?
Wiki breaks down thusly:

As you can see, a goodly chunk of folk making under 20K a year; another goodly chunk on top of it making under, oh, what, 40k?
*****
So, but, okay: did we indeed "
make the pie higher," since oh say 2001 or so? You do hear tell that the economy is "recovering," here and there, no?
Well, according to the
Economic Policy Institute:
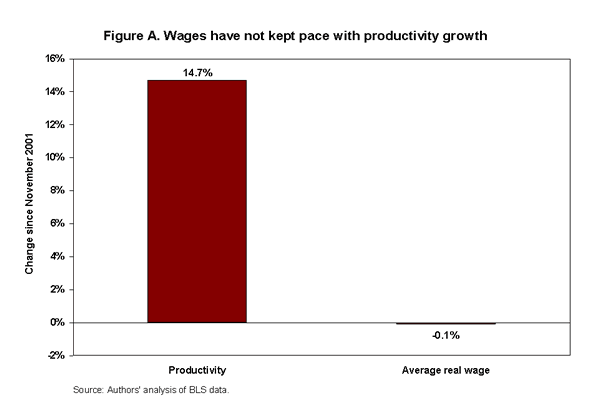
1. Profits are up, but the wages and incomes of average Americans are down.
Inflation-adjusted hourly and weekly wages are below where they were at the start of the recovery in November 2001. Yet, productivity—the growth of the economic pie—is up by 14.7%.1 (  ...Consequently, median household income (inflation-adjusted) has fallen five years in a row and was 4% lower in 2004 than in 1999, falling from $46,129 to $44,389. 2. More and more people are deeper and deeper in debt.
The indebtedness of U.S. households, after adjusting for inflation, has risen 42.0% over the last five years.
The level of debt as a percent of after-tax income is the highest ever measured in our history. Mortgage and consumer debt is now 120% of after-tax income, more than twice the level of 30 years ago.
The debt-service ratio (the percent of after-tax income that goes to pay off debts) is at an all-time high of 13.9%.
The
personal savings rate is negative for the first time since the Depression [emphasis mine]
3. Job creation has not kept up with population growth, and the employment rate has fallen sharply.
The United States has only 1.9% more jobs today than in March 2001 (the start of the last recession). Well, but, see, there
is growth! Growth is good, right?
Private sector jobs are up only 1.5%. At this stage of previous business cycles, jobs had grown by an average of 8.8% and never less than 6.0%. ...oh.
The unemployment rate is relatively low at 4.6%. ...yay?
But the percent of the population that has a job has never recovered since the recession and is still 1.3% lower than in March 2001. If the employment rate had returned to pre-recession levels, almost 4 million more people would be employed. and, I don't have the cite here, but there've been studies that indicate the reason unemployment is "down" is because they're simply going by the people applying for unemployment, on the welfare rolls, on record as actively looking for work, you know. It doesn't take in that in fact a lot have people have simply
given up. or fallen, and can't get up.
And, poverty's on the rise, especially child poverty, rising health costs...you get the picture.
Oh, and it also doesn't talk about how many of those new jobs are in the "service economy;" and how many of those are at minimum wage. Yeah, let's talk about minimum wage for a sec, shall we?
From the
Hartford Courant:
On Saturday, we broke the record for the longest period without an increase in the minimum wage since it was established in 1938. The prior record of nine years and three months lasted from Jan. 1, 1981, until the minimum wage hike on April 1, 1990.That current federal minimum wage, in case you didn't know, is $5.15 an hour. And has been since 1997.
Some state laws have an increase beyond that--I think here in NYC it was 6 bucks, may've been raised recently; on the other hand, and this is going to have to be another one where i don't currently have the cite, but in just a bunch of states, don't know if you knew, they can pay you less if your primary income is deduced to be via tips. As in, waitroning, etc. Two something an hour, was it? I do need to look that one up. I remember that, because there was something or other about how someone recently was trying to push a federal bill to override the few states that had provisos that insisted on the full minimum wage for everyone, not just those who get to collect coins and singles from the ashtray. Guess which party. Hint: it's the same one that, (via the same Courant article), wanted to simply do away with the whole thing:
Murray Weidenbaum, chairman of President Reagan's first Council of Economic Advisers, has acknowledged they wanted to eliminate the minimum wage. But as The Wall Street Journal reported, "Because that would have been such a `painful political process,' Mr. Weidenbaum says that he and other officials were content to let inflation turn the minimum wage into `an effective dead letter.'"
Today's minimum wage is less than the 1950 minimum of $6.28 (adjusted for inflation), according to the Bureau of Labor Statistics inflation calculator. It takes nearly two workers to match the $9.28 buying power of one minimum wage worker in 1968.So what that means is,
A full-time worker at minimum wage makes just $10,712 a year - less than $900 a month to cover housing, food, health care, transportation and other expenses. Today, family health coverage costs more than a minimum wage worker's entire annual income.
The minimum wage sets the wage floor. As the floor has sunk below poverty levels, millions of workers find themselves with paychecks above the minimum, but not above poverty wages. Which means:
CEOs have enriched themselves and their families for generations to come while workers struggle to support themselves and their children. The highest paid CEO in 1968 made as much as 127 average workers and 239 minimum wage workers. The highest paid CEO in 2005 made as much as 7,443 average workers and 23,282 minimum wage workers.Specifically,
...average CEO pay in Business Week's survey was $7.4 million. It would take 241 years for an average worker paid $30,722 to make that amount.
Since 1980, average CEO pay has skyrocketed 442 percent, adjusting for inflation, from $1,364,524. Average worker pay has inched up just 1.6 percent from an inflation-adjusted $30,244 in 1980.
...If average worker pay had grown at the CEO pace, it would be $164,018.
And while, as noted way the hell back up there, this growing disparity is a
global problem, it is also true that the U.S. is even worse about this growing gap than other "First World" countries in many regards. From the above article,
According to the Towers Perrin worldwide pay report, U.S. CEOs are paid more than twice as much as Canadian CEOs, nearly three times as much as British CEOs, and four times as much as German CEOs.and from the
Courant article:
Ireland's minimum wage is $10 and England's is more than $10, calculated in U.S. dollars.Now, (also from the Courant)
Democrats promise to pass a minimum wage hike in the first 100 hours of the new Congress. The long-delayed Fair Minimum Wage Act would raise the minimum wage in three steps to $5.85, 60 days after passage, $6.55 one year later in 2008, and $7.25 one year later in 2009.Which, yay, okay. The
AFL-CIO has a calculator you can use to work out how far you'd get on the minimum wage, based on how many hours you work and your monthly costs (it's a good exercise for personal budgeting, anyway if you don't already do such things). So now, i guess, instead of plugging in $5.15 an hour, you can plug in $7.25 an hour. In two years, I mean.
These are steps in the right direction for workers for whom every dollar counts in the struggle to make ends meet. But workers should not have to wait until 2009 for a $7.25 minimum wage that only partly restores buying power lost since 1968.
As they (Courant again) say.
And that's not even getting to the crap about, o, transnational corporations, effects of globalization...
*****
I'll be honest. I had a bunch of reasons for not tackling this shit before; dunno if they're the same as y'all's or not. Well, one, I suppose relatively speaking I am comfortable enough to sort-of pretend this isn't actually happening (although denial works in mysterious ways, doesn't it); certainly more so if you factor in my family background, who by now i expect is in, oh, i don't know what percentile, but i suspect it's up there. Not in the supra-wealthy micro-fraction percentile, no, but...and especially globally...so.
And, gender stereotypes or not, I've always had issues with numbers, personally. I wasn't kidding: math and anything related literally gives me nightmares. (I dread my upcoming statistics class).
And let's face it: this shit's boring compared to, oh I don't know, blowjobs.
And yet.
Somehow, you know, call it a hunch; i have the feeling that even if I, we, most, all? of us? don't start concerning ourselves with this shit pretty soon?
It's gonna concern itself with us.
I mean, the
rest of us; the ones who aren't already reading this and going, um, HELLO? film at eleven?
And, I suspect, even those of us who aren't currently calculating whether to buy soap or toilet paper (because it can't be both), seriously freaked out about keeping the lights on, food on the table...it takes its toll, in ways probably not thought about at the conscious level. This
Alternet article puts it well, I think:
Contra the right's liberal media conspiracy theories, the major media from across the spectrum are reporting the good news about America's booming economy with zeal.
That endless drumbeat comes with social costs.
First, it fuels the bubble mentality. If the economy's going gangbusters but you're struggling, of course you want to get in on the latest billionaire-creating wealth machine. That mentality infected anyone who bought tech stocks in 1999 hoping to become a "dot-com millionaire," just as it has them running around today buying houses at any price with the expectation that they'll get a 10 percent annual return. Alan Greenspan characterized the mindset as being one of "irrational exuberance." But what could be more rational than piling onto the latest bandwagon after watching a half-hour of CNBC's economic triumphalism?
Less easy to quantify is the psychic cost this has on us. The message we get all the time is that our unrivalled, dynamic economy affords opportunities for us all. So, if you're one of the majority who is not doing so well, it must be your fault. It is you, and not any external economic factor, that is keeping you from profiting from the Ownership Society. You are a loser.
...Despite our great wealth, we're an unhappy people; we lead the world in mental health problems year in and year out. It's impossible to know to what degree that results from failing to live up to the economic expectations drummed into our heads every time we hear about the wonders of the American economy. But the message to all those families struggling to get by should be: You're not alone, it's all of us.*****
Dennis Moore:
What did you sing?
Singers:
(speaking)
We sang... he steals from the poor and gives to the rich.
Dennis Moore:
Wait a tic... blimey, this redistribution of wealth is trickier than I thought.